Where Do Penn State Statistics PhD Students Go After They Graduate? (2022 Update)
A version of this article was originally written in 2019. Now that I’ve graduated and as part of moving my website to Hashnode I decided to revisit this analysis with data through Summer 2022.
When I was a statistics PhD student, I was often asked what I intended to do after I graduate. After I’d give my answer, the next natural question was “where do PhD students from your department usually go after they graduate?” This question also came up every year when prospective students visited our department.
In the past, my answer to that second question was that 1/3rd of our graduates went to academia, 1/3rd went into industry, and roughly 1/3rd went into what could loosely be defined as “other,” which are jobs that are not quite academia but also not industry either, such as those at a national lab, a government agency, or a think tank like the RAND Corporation. This was more of a guess than anything based on real data, mostly because while we do have a webpage with where our alumni go after they graduate (https://science.psu.edu/stat/alumni/members), that information is not in a format that’s easily analyzable.
Nonetheless, I do actually want the answer to this question. Part of this is so that I can actually give a good answer to prospective students (or other people who are curious), and part of it is just to satisfy my own curiosity. I recently spent some time organizing the available data into a more manageable CSV file so that I can finally answer the question of where Penn State statistics PhD graduates go.
The Data
All of the data was taken off of the website link above for graduates from 2010 until 2022. Previously, I had chosen 2010 as a cutoff because data from before 2010 seemed more incomplete, and I thought that data from before 2010 wouldn’t be representative of recent trends in the department. Of course, now we have more recent data, but since I already collected the previous data, I’m keeping it.
Limitations of the Data
There are a few limitations from this dataset that are worth noting:
- This data only includes up to people who would graduate in the 2022 calendar year: some individuals might defend their dissertation in the Fall 2022 semester, but as of this publication date nobody has announced or defended yet this semester, and anyone defending after today will only be eligible to graduate in Spring of 2023.
- The information about first jobs is self-reported by the people graduating. In the case of some individuals not publicly listed, I have used personal recollection and some searches to find their first post-graduation job.
- Only people who graduated with a PhD are included in this dataset. People sometimes withdrew or graduated with a Master’s for a variety of reasons, but this analysis is focused on PhD graduates due to them making up the overwhelming number of people who graduate from the PhD program.
- A couple of PhD graduates were excluded from the analysis because no job information was provided nor could be found online.
Overall, this meant that I had information on 157 graduates and the first jobs and institutions they went to.
All of the data as well as the RMarkdown file (with the R code) can be found here: https://github.com/yazhao/PSUPhdGrads
Definitions
For the purposes of this analysis, I looked only at the first job taken by graduates right after they got their PhD. It’s entirely possible that many of these people switched career tracks, but tracking down that full information proved to be difficult. Additionally, I’m mostly interested in where people are first placed, not necessarily where they ultimately end up. I wanted to see what the immediate next step of a Penn State statistics PhD would be. The three categories of jobs were:
Academia: This includes any job working at an academic institution like a university. It also included any first job where the title would imply postdoc (ie “postdoctoral researcher”). This was an overly broad definition, and so I included people who weren’t strictly on a tenure-track assistant professorship, but rather anyone who got a job in an academic setting.
Industry: Anyone who went to work at a private company was put into this category.
Other: This included jobs and institutions that weren’t necessarily academia but also clearly were not industry. In this category included working at a government agency, a national lab, central banks, and non-profit think tanks.
In the cases where I didn’t have a first job title, I used the first job location to define the job type.
Summary
##
## Academia Industry    Other
##    54.14    38.22     7.64
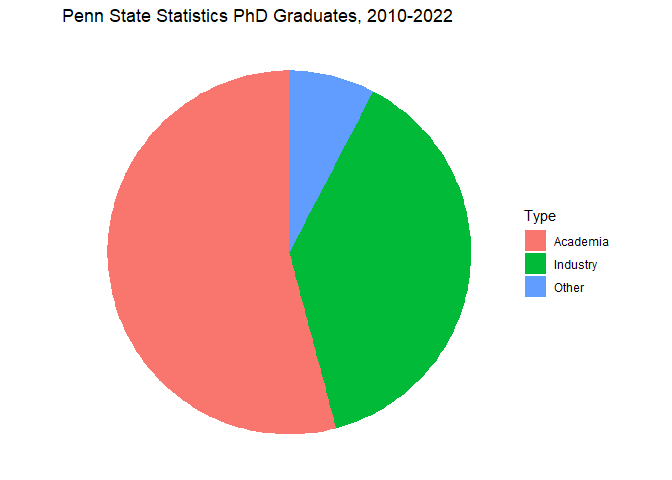
Based on the past 13 years worth of data, it seems that the majority of our PhD graduates go into academia. Over 50 percent of our graduates end up in academia with their first job, a little under 40 percent go into private industry, while only about 7.5 percent go into that Other category. It seems that my initial impressions (and the answer I’ve been giving people) were wrong. And while these numbers might be inflated due to my broad definition of an academic job, it seems that our department largely prepares people for academia.
Trends
I was curious to see if the trends behind these first jobs had changed over the time of the dataset. Was this pattern of mostly academic jobs relatively consistent, or have there been changes in the composition of jobs over time?
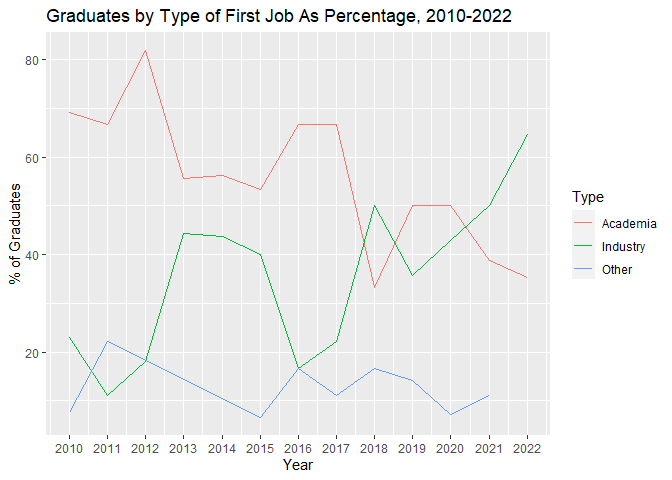
It seems like there has definitely been changes in the category compositions over time. Initially, basically all graduates went into academia. However, around 2013, that trend started shifting, as more students went into industry. That trend reversed in 2016, though that change was mostly because of people going into the Other category. By 2018, it was a roughly even split between academia and industry positions, and since 2021 the number of people going into industry jobs has exceeded those going into academia. People going into “other” jobs has all but fallen off in that timeframe.
Conclusion
My intuition that the department was roughly evenly split among the three types of jobs for graduates was obviously incorrect. Most of my mistake was in overestimating the share of people going into research positions in the Other category, possibly partly due to the people I knew when I was starting in the program. Based on historical data, the academic/industry/other split is approximately 50/40/10. In recent years, however, that trend has been changing, and post-2020 it’s been more 50/50 academia/industry, with “other” jobs falling off. Moreover, it looks like after 2020 the trend has been towards a 60/40 split between industry and academic jobs, respectively.
This updated analysis also further solidifies the trend that I initially saw in 2018: while the initial percent of people going to academia recovered from the one-time 2018 dip, it’s now the case that industry jobs are more popular than academic ones for students from Penn State’s statistics department.
Of course, this kind of analysis has a lot of caveats. It’s possible that people going into industry might not be as interested in filling out this information, or people going into jobs that they don’t particularly like. It’s also possible that a lot of the people who first get an academic job (notably, many of those who are lecturers or postdocs) might end up switching tracks and going into industry or some other type of job, while the reverse trend might be much less common.
Nonetheless, this information does seem to capture a trend: while in the past most graduates first went into academic jobs, it seems like more and more statistics PhD students at Penn State are willing to jump into industry first. In any case, at least now I have a more accurate answer to the question of “Where do Penn State statistics PhD students go after they graduate?” the next time somebody asks.